Use the Format Numbers dialog box to format the appearance of one or more variables appearing in tables and the scale and scrub information in Graphs.
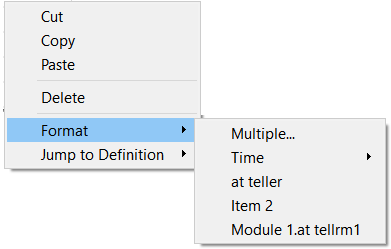
To open the Format Numbers dialog box, right-click (Ctrl-click on the Mac) inside of the table or graph:

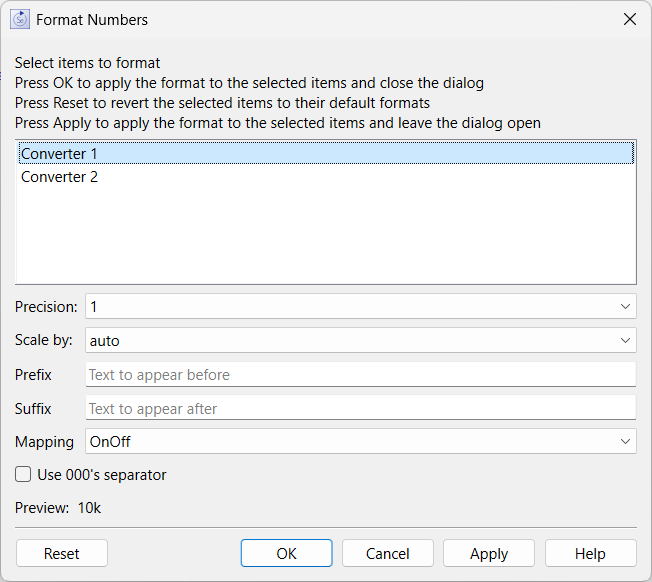
Then, on the menu that appears, select Format. Select Multiple from the submenu that appears. The dialog will open:

Select one or more items in the list to change the formatting. You can select multiple items by holding down the shift key to select a range or the control key to toggle selection on and off on individual items. As you change selection the items below will update to reflect the current selection. If the selected items have different formats, the items below will be blank.
Precision sets the precision for the displayed number. This is applied after scaling is applied.
Scale by will divide by thousands, millions or billions before displaying the number.
Prefix shows text that will appear before the number (such as a $). Note that the negative sign will precede the prefix for negative numbers. Blank by default.
Suffix shows text that will appear after the number (such as %). Blank by default.
Mapping shows the number-text mapping to use when formatting values. Select a value from the dropdown. The available values are controlled from the Manage Number-Text Mappings dialog box. Select No number-text mapping to only display numeric values.
Use 000's separator, if checked, will place either a , or a . between thousands separator depending on the users locale.
Preview displays a number using the selected formatting.
Reset will reset the selected variables to use the settings they have in scales and ranges.
OK will apply the changes you have made to the current graph or table and close the dialog.
Cancel will not make any changes to the current graph or table.
Apply will apply the changes, but leave the dialog open. You can then select another variable to make changes to.
Help will open this help page.
Note: The selections you make here for precision, units, and scaling affect the display on the graph or table only. They don't change the way the variable is presented elsewhere in the model, or the way that its value is computed.